


Determining livestock production’s contribution to atmospheric greenhouse gases
 Print
Print Email
EmailResponding to environmental concerns two commodities—pork and dairy—have developed tools to assess the greenhouse gas emissions associate with their farms.
Environmental concern and awareness has encouraged all industries, including the livestock sector of food production, to assess their contributions to the greenhouse gases (GHG) emitted into the atmosphere. The main greenhouse gases associated with livestock and poultry include carbon dioxide (CO2), methane (CH4), and nitrous oxide (N2O). Methane has 24 times and nitrous oxide has 298 times the global warming potential, or “greenhouse effect,” of CO2. When discussing GHG emissions, CH4 and N2O are expressed as carbon dioxide equivalents (CO2e). Carbon footprint is often times used as a general reference to the amount of GHG emitted from the sum of activities.
While CO2 is the standard by which greenhouse gases are measured, CH4 from enteric digestion and manure storage and N2O related to the production of crops used for feed and also from manure storage make significant contributions to the total carbon footprint of livestock production.
Two livestock commodity groups have taken an active role in assessing their commodity’s carbon footprint. The Center for Agriculture and Rural Sustainability at the University of Arkansas has modeled the carbon footprint for the dairy industry, providing milk producers a baseline for their industry’s carbon footprint. This assessment was supported by Dairy Management, Inc. The National Pork Board supported the development of the Live Swine Carbon Footprint Calculator, a tool for estimating GHG emissions from individual farms which was written by Dr. Rick Ulrich and Dr. Greg Thoma, both faculty at the University of Arkansas. A previous MSU Extension News for Agriculture article discussed the use and availability of the swine footprint calculator. That article may be found at: http://news.msue.msu.edu/news/article/live_swine_carbon_footprint_calculator_is_now_available_for_pork_producers .
Dr. Marty Matlock from University of Arkansas’s Center for Agriculture and Rural Sustainability presented the Center’s findings on the dairy farm’s carbon footprint while speaking at the 2011 Michigan Agriculture’s Conference on the Environment. Enteric methane makes a large contribution to the carbon footprint on dairy farms due to rumen digestion. According to Dr. Matlock’s presentation, on average, 33% of the CO2e emissions from a dairy farm is the result of enteric digestion; manure management contributes another 33% of the farm CO2e emissions, feed is approximately 26% and on-farm energy use, 4%.
On a per unit of production basis, Popp (2010) reported a range of 0.70 to 2.0 kg CO2e per kg Fat Protein Corrected Milk (FPCM) for most US dairies. The United Nations Food and Agriculture Organization (FAO, 2010) reported that North American dairy farms average 1.0 kg CO2e per kg FMPC, well within the range Popp reported.
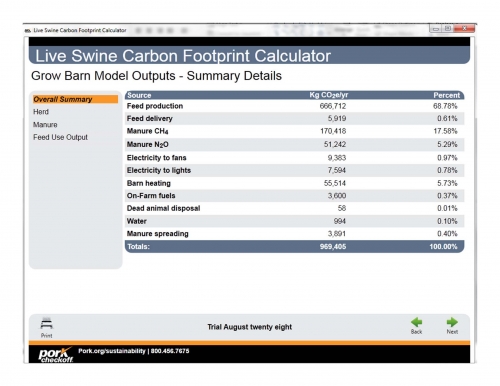 Figure 1. provides an overall summary from the Swine Carbon Footprint Calculator for a sample 2,000 head, deep pit, finishing barn, selling 5,100 head annually at an average weight of 275 lbs. and feed efficiency of 2.98 lbs. feed per lb. gain. For this sample farm, 68.8% of the estimated 969,405 kg (1,068.8 tons) CO2e annually emitted are attributed to feed, 22.9% to manure (CH4 and N2O combined) and 7.5% to barn heating and electricity. The high percent of GHG emissions attributed to feed is directly related to the N2O losses associated with the growing crops and, to a lesser degree, the fossil fuels required for crop production including the fuels used in the manufacturing of ag chemicals and nitrogen fertilizers.
Improving feed efficiency to 2.69 lbs. feed per lb. gain decreased GHG emissions 11.6% to 856,576 kg (944.4 tons) CO2e annually while the break down attributable to feed, manure and barn utilities, 70.1%, 21.2% and 7.7% respectively, remained relatively the same. Improving feed efficiency provides the dual benefits of reducing GHG associated with feed production and reducing CH4 and N2O emissions associated with enteric fermentation and manure management (Nguyen, 2010). The relationship between GHG attributed to feed and GHG attributed to manure remained relatively constant as feed efficiency improved.
Using a feed efficiency of 2.98, the Live Swine Carbon Foot Print Calculator estimated an emission of 1.52 kg CO2e per kg live pig. Improving feed efficiency to 2.68 reduced the carbon footprint to 1.35 kg CO2e per kg live pig.
The 12% decrease in GHG emissions resulted from improved feed utilization. Additional gains are possible. Nguyen (2010) compared three scenarios: 1) improved feed efficiency, 2) shortened length of time manure is stored in the barn (to less than 15 days), and 3) improved manure management including utilizing manure for energy production prior to using it as a replacement for commercial fertilizer. His model predicted a 49% reduction in GHG emissions if all three areas were improved simultaneously.
Estimating livestock’s contribution to GHG emissions and establishing a current baseline is important to future decision making. This information will contribute to farmer’s, and entire industry’s, ability to respond to potential reductions in GHG emissions. Important opportunities to reduce GHG emissions associated with livestock production are through increase feed efficiency, reduced energy inputs and improved utilization of manure; all areas where livestock farms already have a proven track record.


