


Great Lakes water levels for the summer of 2015 - what’s up (or not)?
 Print
Print Email
EmailIn January of 2013 record-low levels for Lake Michigan were recorded. In 2014, Great Lakes water levels rebounded. What’s the forecast for summer 2015 lake levels?

The warm weather has arrive and Michigan is coming out of another particularly long, cold and snowy winter. Now, many residents are desperately looking forward to summer fun. In Michigan, summer often means fun on the water, including in the Great Lakes. With the extreme winters we’ve had the past two years, a reasonable question is the lakes will look this summer.
Michigan State University Extension has reviewed why Great Lakes water levels change over different periods of time in earlier articles (What’s up [or not], with Great Lakes water levels/Part 1, What’s up [or not] with Great Lakes water levels/Part 2), but what about this year? Actually, it’s easy for anyone to discover and understand what this summer’s lake levels are likely to be.
Current information on Great Lakes hydrology, and projections that extend six months into the future, are available to anyone online through the Monthly Bulletin of Great Lakes Water Levels, produced by the U.S. Army Corps of Engineers. And the NOAA Great Lakes Environmental Research Laboratory has developed an online Great Lakes Water Level Dashboard which allows anyone to access and graphically manipulate a variety of historical datasets, dating back into the 1800s. You may also view current conditions as well as forecasts for both the short and long term.
For our purposes, however, the Monthly Bulletin will suffice Here’s what to expect for each of the Great Lakes and also Lake St. Clair.
Lake Superior
In 2013, Lake Superior levels peaked in September at approximately 602 feet above sea level. In 2014, the annual maximum took place in October, at 602.9 feet. These compare with the long-term average (1918-2014) summer maximum for Superior of approximately 602.2 feet. The projection for the 2015 summer maximum of 602.6 feet in August, with a range of 602.1 to 603.
Lakes Michigan and Huron
These lakes share a common water level thanks to the Straits of Mackinac, and are considered to be one lake hydrologically. In 2013 their levels peaked in July at 577.8 feet (after setting a record January low seven months previously). In 2014, the peak came in October at nearly 579.3 feet above sea level. This is the same as the long-term summer maximum averaged over the 1918-2014 period, which typically takes place in July. The projection for the summer 2015 maximum is 580 feet, with a range of 579.4 to 580.6, meaning that levels will likely exceed the long-term mean.
Lake St. Clair
Lake St. Clair is not one of the Great Lakes, but is a connecting waterway linking the Great Lakes. It is, however, often called the best muskellunge (muskie) fishing lake in North America, and Bassmaster Magazine ranked it No. 1 on its list of Best Bass Lakes of 2013, so it does have a lot going for it! As for its water levels, the summer peak in 2013 took place in July at 574.6 feet above sea level. In 2014, it was a half foot higher at 575.1 feet. These compare with the long-term average summer maximum of 574.9. For 2015, another increase is in the forecast, with a July peak at 575.5 feet within a range of 574.6 to 576 feet.
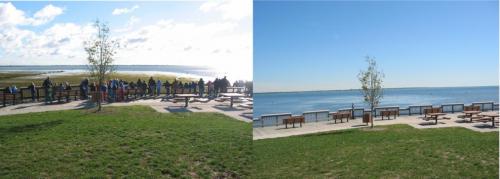
Low water levels on Lake Erie (left) compared to high water levels (right). | Michigan Sea Grant
Lake Erie
In 2013 Lake Erie peaked at 572 feet above sea level in July. In 2014, Erie experienced a slight increase, with the summer maximum of 572.2 again coming in July. The long-term average summer maximum is 571.8. For 2015, the forecast is for a very slight decrease back to 572, again happening in July, with a forecast range of 571.6 to 572.9 feet.
Lake Ontario
Michigan has shoreline on all the Great Lakes but Ontario, which empties into the St. Lawrence River and then flows on to the Atlantic Ocean. Lake Ontario’s 2012 maximum 245.5 feet above sea level, and was reached in April. Ontario’s 2013 maximum was 246.3, exceeding the long-term average of 246.1, and came in July. In 2014, the summer peak took place in June and was up a bit to 246.5. This year, the summer maximum in July is expected to drop a bit to 246, with a projected range of 245.7 to 246.4 feet.
As the above information shows, projected 2015 Great Lakes water levels along Michigan’s shorelines are generally up compared with the past two years, and should afford plenty of opportunities for recreational activities of all kinds. Enjoy!
Michigan Sea Grant, a collaborative effort of the University of Michigan and Michigan State University, promotes knowledge of the Great Lakes through research, outreach and education. Michigan Sea Grant is part of the NOAA-National Sea Grant network of 33 university-based programs in coastal areas around the country, including Guam and Puerto Rico.


