


Lake Superior water levels predicted to break monthly record highs in June/July 2019
 Print
Print Email
EmailLakes Michigan, Huron levels also expected to be high.

Monthly forecasts for Great Lakes levels in April 2019 have just been released by the U.S. Army Corps of Engineers. These 6-month forecasts are currently the best tool in the toolbox to show predictions of Great Lake levels. The “most probable model” used by the Corps of Engineers is quite accurate, especially for the next 3 months. The data show something significant for Lake Superior in particular: Lake Superior levels are predicted to break the monthly average record in June 2019 (and possibly July) while being just 2” below this “period of record” average in April and May. Mostly likely there will be erosion issues and other impacts from these record high levels.
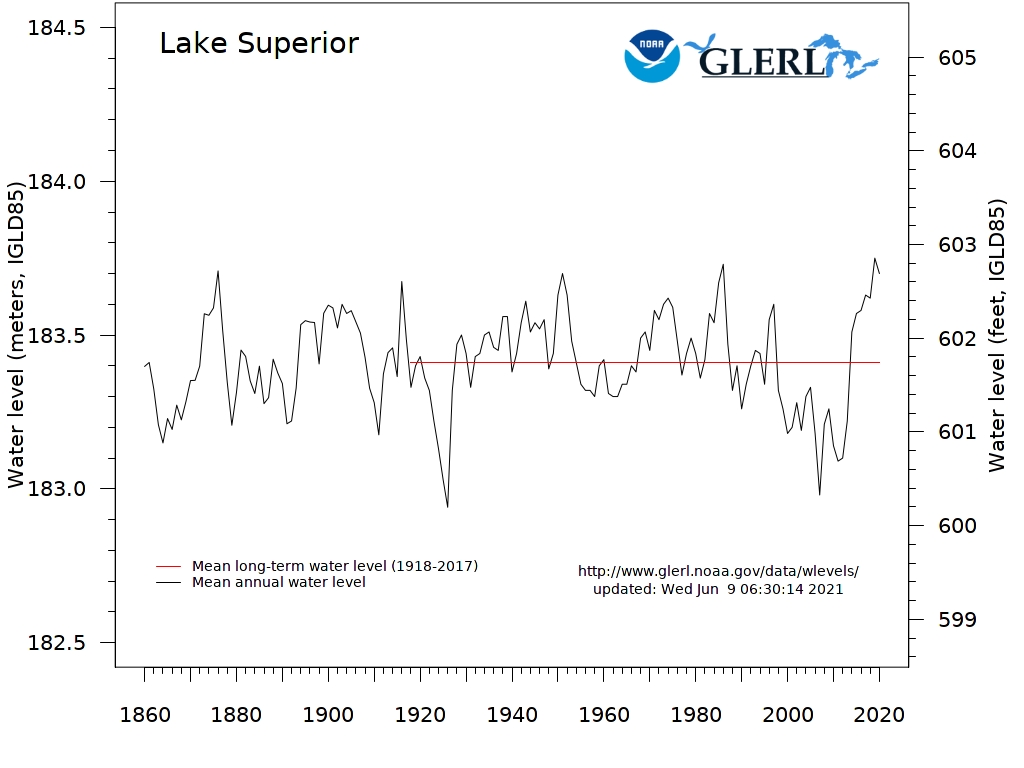
Period of record average
There exists long-term level data for all the Great Lakes, particularly since 1918. This is known by scientists as the Lake-wide period of record average. 2018 marked the centennial year of accurate lake level measurements from the series of binational gaging stations where measurements for Lake Superior are taken in Duluth, MN.; Marquette, MI.; Pt. Iroquois, MI.; Thunder Bay and Michipicoten, ONT. This geographically dispersed gaging network accounts for seiches and other short-term fluctuations and provides high quality accurate information. The yearly long-term water level, including information from lake level stations which existed prior to the period of record (from the 1860s to 1917), is available at the Great Lakes Environmental Research Laboratory (GLERL).
Lake Superior’s compensating works
The International Lake Superior Board of Control has a Regulation Plan 2012 and is responsible for regulating the outflow and control works in the St. Mary’s River at Sault Ste Marie. This Board has been in place since 1914 and has compensating works which allow for some limited variation. This plan must meet multiple objectives including hydropower; municipal and industrial water supply, navigation through the locks, and maintaining a minimum flow for protection of fish habitat in the St. Mary’s River. The April 3, 2019, control board update states:
“Relatively wet conditions continued across the upper Great Lakes basin in March, and water levels of Lake Superior and Lake Michigan-Huron remain well above average. The above-average levels coupled with strong winds and waves continue to result in shoreline erosion and coastal damages across the upper Great Lakes system. Additional shoreline erosion and coastal damages may occur this spring should active weather continue. … The Board stresses that hydrologic conditions are the primary driver of water level fluctuations. Water levels of the Great Lakes cannot be fully controlled through regulation of outflows, nor can regulation completely eliminate the risk of extreme water levels from occurring during periods of severe weather and water supply conditions. It is not possible to accurately predict such conditions weeks in advance, but given the current levels of the lakes, the Board advises all those that may be impacted to prepare for the above-average water levels, should they continue this spring.”

System snow melt in the Lake Superior basin impacts the spring seasonal rise as the snow turns into liquid water along with rain storm inputs. Since waves are all wind-driven in the Great Lakes, storms and pressure fronts will drive waves into the shores and spring storms can cause a good amount of erosion damage.
(Larger graphic images available: Lake Superior, Lakes Michigan and Huron)
Tools to visualize changes
Online mapping information is a powerful visual asset. One tool for shoreline owners and other interests is the Great Lakes Shoreview risk assessment tool (http://www.greatlakesshoreviewer.org/#/great-lakes). This tool, funded by the Michigan Department of Natural Resources Office of the Great Lakes, is a web-based mapping tool that shows oblique photos from the Lake Superior shoreline, some nearshore LIDAR data, and some risk rankings for erosion.
Another tool to note is the NOAA Lake Levels Viewer tool. Similarly, this web-based mapping tool allows users to artificially fluctuate levels up or down and see impacts on the shore. The tool is found on NOAA’s Digital Coast website at https://coast.noaa.gov/llv/. Select the lake you are interested in, zoom to your geographic area, and use the legend bar to vary the lake levels. You will see impacts on the screen.
Finally, if you’re interested in reviewing historical data on Great Lakes levels, the NOAA Great Lakes Environmental Research Lab has a great tool showing data from the period of record for each Great Lake. Called the Great Lakes Dashboard Project, this tool is even available for use with mobile devices.
*This article contains updated information and is a revision of an article previously published in 2018.
Michigan Sea Grant helps to foster economic growth and protect Michigan’s coastal, Great Lakes resources through education, research and outreach. A collaborative effort of the University of Michigan and Michigan State University and its MSU Extension, Michigan Sea Grant is part of the NOAA-National Sea Grant network of 33 university-based programs.
This article was prepared by Extension educator Mark Breederland under award NA14OAR4170070 from the National Oceanic and Atmospheric Administration, U.S. Department of Commerce through the Regents of the University of Michigan. The statements, findings, conclusions, and recommendations are those of the author(s) and do not necessarily reflect the views of the National Oceanic and Atmospheric Administration, the Department of Commerce, or the Regents of the University of Michigan.


