


Not all milk-to-feed ratios are created equal (Part 2)
 Print
Print Email
EmailFor decades, the USDA milk-to-feed ratio has been touted as a predictor of dairy farm profitability.
The first article in this series of Michigan State University Extension news articles pointed out by using actual milk-to-feed ratio data for May 2009 and March 2012 that not all milk-to-feed ratios are created equal. The milk-to-feed ratio in May 2009 was 1.49 and was nearly identical at 1.48 in March 2012. The milk-to-feed ratio is promoted as a proxy measure for dairy farm profitability. Thus, many popular press publications and websites would conclude that profitability for dairy producers would be the same in those two months because of the nearly identical milk-to-feed ratios. However, in November, it was clearly shown that such is not necessarily the case. Because the milk-to-feed ratio is indeed a ratio it fails to take into account the size of the pie represented by a specific milk-to-feed ratio. Therefore, it was pointed out in the first article in this series that a more accurate measure of profitability, income over feed costs (IOFC), can be calculated using the same milk-to-feed ratio data. Thus, despite nearly equal milk-to-feed ratios in May 2009 and March 2012, IOFC’s in March 2012 were 48 percent higher. Before reading further, please take the time to review the first article, Not all milk-to-feed ratios are created equal (Part 1).
The first article also noted that conventional wisdom predicts when the milk-to-feed ratio is above 3.0 milk production is considered more profitable and dairy producers, as an industry, will tend to expand production by adding more cows, decreased culling, and increased milk per cow by feeding more concentrates. When the milk-to-feed ratio drops below 2.0, conventional wisdom says milk production is less profitable and dairy producers, as an industry, will contract by some producers going out of business, increased culling, and/or decreased milk per cow by feeding fewer concentrates. If this conventional wisdom is true it holds very important implications. If accurate, the magnitude and direction of the milk-to-feed ratio should help dairy producers predict what will happen to future trends in national milk production and milk prices. If conventional wisdom is wrong, producers should beware of making milk and feed marketing decisions based upon the magnitude and direction of the milk-to-feed ratio.
I believe conventional wisdom concerning the milk-to-feed ratio is often wrong. There has been a major paradigm shift in the dairy industry which began in 2007. From 1998 through 2006 the milk-to-feed ratio averaged 3.05 and that average dropped by nearly a third to only 2.06 from 2007-present. Conventional wisdom would then predict U.S. dairy cow numbers would decline when comparing the 1998-2006 period with the 2007-present period. That is exactly what the numbers show. Although the differences between the two periods are not great, it is true that the average size of the U.S. dairy herd declined by 39,000 cows in the 2007-present period as compared with the earlier period. It is also true that the average annual growth of total U.S. milk production grew by +1.8 percent 1998-2006 and the average growth rate dropped to +1.5 percent 2007-2011. However, given the drastic change in the average milk-to-feed ratio one would have predicted a much larger decline in milk production 2007-present as compared with 1998-2006 if conventional wisdom were accurate. These data definitely cast suspicion upon conventional wisdom concerning the milk-to-feed ratio.
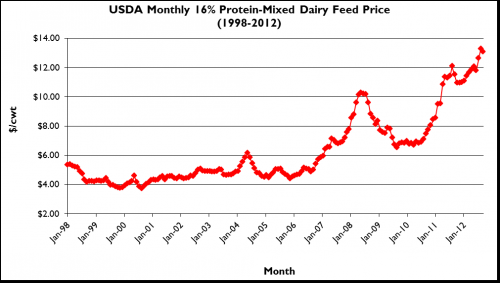
Table 1 contains milk-to-feed ratio data for the two time periods plus a comparison of average income over feed costs (IOFC). Average prices for all three constituents of the 16 percent protein-mixed dairy feed used to calculate the milk-to-feed ratio (corn price, soybean price, and alfalfa hay price) have all increased quite dramatically. Figure 1 shows a graph of the price of the 16 percent protein-mixed dairy feed from 1998 to present and it is obvious the U.S. dairy industry entered a new era in 2007. Graphs of the corn price, soybean price and alfalfa hay price are identical in shape. I believe this paradigm shift was primarily driven by the U.S. ethanol industry’s influence on corn production. For a more thorough analysis of that hypothesis see my article A new paradigm in milk marketing.
In Part 1 of this series I noted that a primary problem in interpreting the milk-to-feed ratio was due to the very fact that it is a ratio. Recall that a ratio does not take into account the size of the pie. For example, which would you rather have, a 20 percent slice of an 8-inch apple pie or a 20 percent slice of a 16-inch apple pie? In both cases you receive the same ratio of the pie (i.e., 20 percent), but in the latter case you will receive a much large slice in an absolute sense. The same is true when it comes to the milk-to-feed ratio. Therefore, to properly evaluate a specific ratio we need to take into account the size of the pie. Table 1 shows that the average all-milk price increased 24 percent ($3.36/cwt) in 2007-present as compared with 1998-2006. Therefore, the size of the pie grew and despite the precipitous decline in the average milk-to-feed ratio, average IOFC’s actually grew slightly in the 2007-present as compared to 1998-2006. This does not mean there were not some rough years in the 2007-present period (who can forget 2009!). But this paradigm shift does mean a new normal for lower milk-to-feed ratios and the old paradigm of conventional wisdom concerning the effect of the milk-to-feed ratio on the U.S. dairy industry is no longer valid. In fact, from 1998-2006 the milk-to-feed ratio never dropped below 2.0. However, from 2007 to present, a 69 month time period, the milk-to-feed ratio has been below 2.0 over 50 percent of the time (35 of 69 months).
|
Measure |
1998-2007 Average |
2007-Present Average |
|
Milk-to-feed ratio |
3.05 |
2.06 |
|
All-milk price ($/cwt) |
$14.00 |
$17.36 |
|
Corn price ($/bu) |
$2.11 |
$4.65 |
|
Soybean price ($/bu) |
$5.54 |
$10.81 |
|
Alfalfa hay price ($/ton) |
$96.44 |
$149.59 |
|
16 percent protein-mixed dairy feed ($/cwt of feed) |
$4.63 |
$8.74 |
|
Income over feed costs ($/cow/day1) |
$8.60 |
$8.99 |
1Income over feed costs calculated at daily average milk production per cow of 80 pounds and daily feed per cow of 56 pounds of 16 percent protein-mixed dairy feed.
Figure 1. The USDA monthly 16 percent protein-mixed dairy feed
price ($/cwt
of feed), 1998-present.
Another comparison to drive this point home is to compare the entire year of 2009 with 2011. Dairy profitability was abysmal in 2009, but quite healthy in 2011. However, by only comparing the average milk-to-feed ratio for the two years one would never come to that conclusion using conventional milk-to-feed ratio wisdom. The average milk-to-feed ratio in 2009 was 1.78 and only slightly better in 2011 at 1.88. However, in 2009 the average all-milk price was only $12.84/cwt while in 2011 it was a very robust $20.13/cwt. If you will, the size of the pie in 2011 was much larger, therefore, despite higher feed costs (2009, $7.29/cwt of feed; 2011, $10.73/cwt of feed), 2011’s average IOFC’s were over 63 percent higher than 2009 (2009, $6.19/cow/day; 2011, $10.10/cow/day) giving the hypothetical dairy producer in 2012 an average of $3.91 more per cow per day to pay non-feed expenses (+63 percent).
Figure 2 shows these relationships graphically. On the graph you’ll notice both the actual 2009 (red line and re diamonds) and 2011 (green line and green triangles) IOFC’s by month. The two lines show that even though the average annual milk-to-feed ratio differed by only 0.10 points and both averages were below 2.0, the average IOFC’s differed by $3.91/cow/day (2009, $6.19/cow/day; 2011, $10.10/cow/day). Again, in 2011 the average milk price (size of the pie) was larger by $7.29/cwt (2009, $12.84/cwt; 2011, $20.13/cwt). Even if you calculate 2011’s IOFC’s using the monthly 2009 milk-to-feed ratios the pie is still large enough in 2011 to produce an average IOFC greater than 2009 (+$3.40/cow/day).
Figure 2: Comparing income over feed
costs for two years with nearly the same average
milk-to-feed ratio.
The difference in IOFC’s for the two years had very dramatic impacts on the entire U.S. dairy industry that the milk-to-feed ratios would not have predicted using conventional wisdom. Recall that conventional wisdom says milk-to-feed ratios below 2.0 predict dairy industry contraction. That happened in 2009 with total U.S. milk production declining 0.1 percent as compared to 2008 and dairy cow numbers declining by 252,000 head from December 2008 to December 2009. A similar average milk-to-feed ratio in 2011 would have predicted similar results. However in 2011 total milk production grew by +1.8 percent over 2010 and dairy cow numbers grew by 82,000 head from December 2010 to December 2011. Therefore, don’t take milk-to-feed ratios at face value nor place a great deal of reliance on conventional milk-to-feed ratio wisdom. In our next article we will examine several other reasons we need to be cautious when interpreting the milk-to-feed ratio.
Related articles:


